
50+ Ecommerce KPI Examples Across Sales, Marketing & Customer Service To Help Grow Your Business in 2024
Key Performance Indicators (KPIs) are a vital component of any business that seeks growth and scalability. They help you determine which parts of your business are thriving and which areas require improvement. Attempting to operate without KPIs is a recipe for disaster.
KPIs should guide every aspect of your business. They provide insight into your customers' needs, determine the best time and place to sell your products, and suggest numerous other enhancements you can make to your business.
What are ecommerce-specific KPIs?
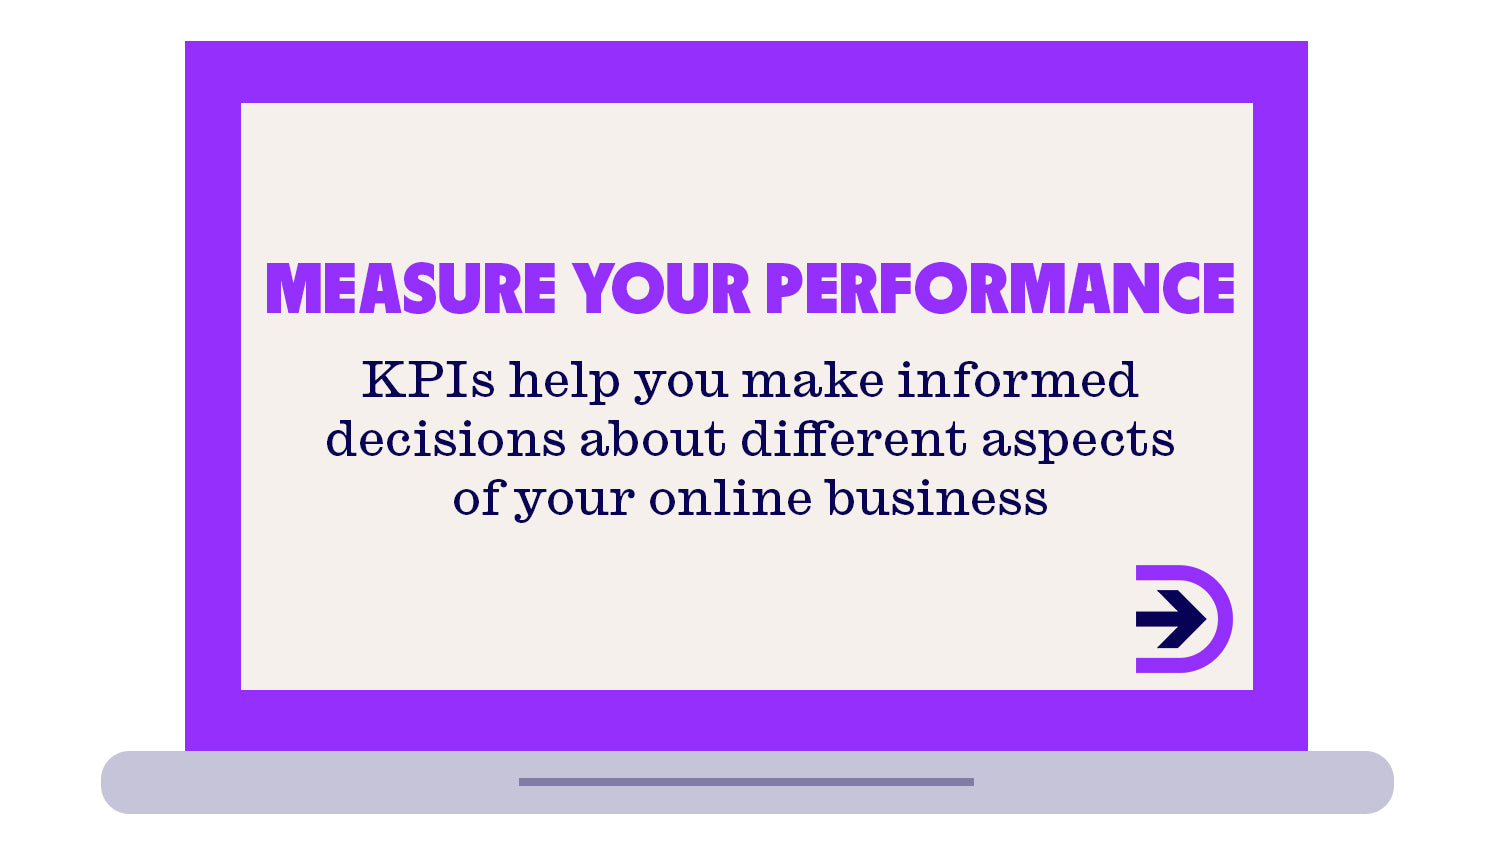
Ecommerce KPIs are metrics that measure the performance of an online business. They play a crucial role in setting missions and goals for your business. These metrics help you make informed decisions about different aspects of your online business such as sales, marketing, customer service, manufacturing, and project management.
Why are ecommerce KPIs important for your online store?
In today’s online landscape, it is crucial for ecommerce businesses to understand their performance and measure their success. This is where ecommerce KPIs come in handy. KPIs are important metrics that help businesses evaluate and track their progress towards achieving their desired objectives. They provide valuable insights into the overall health of the company as well as help identify areas that need improvement. By setting and tracking KPIs, businesses can make informed decisions and ultimately drive growth and success. KPIs can be used for various purposes such as measuring customer satisfaction, employee performance, marketing campaign success, and financial performance.
One of the primary advantages of KPIs is that they enable continuous improvement for businesses. Instead of reaching a threshold of sales and not being able to progress, KPIs provide a clear way to measure success and help businesses stay focused on their goals. Setting clear goals is essential for businesses to optimise their operations and provide team members with a common objective to work towards. They provide clarity on what needs to be achieved and what areas need improvement, as well as an added level of motivation.
By tracking KPIs, businesses can understand their performance and collect data and analytics that contribute to their decision-making process. This information can be used to learn more about the marketing strategies that work best for the business, what channels to sell on, what kinds of products to sell and when. It can also help businesses identify their customers' needs, allowing them to improve their overall customer satisfaction.
KPIs are also useful for identifying areas of the business that need improvement and the areas where they are performing well. By tracking KPIs, businesses can gain insights into what they need to focus on to drive growth and success. This ultimately helps businesses put their money and time towards the right things, rather than wasting time focusing on areas of the business that are already performing well.
The difference between KPIs for sales, marketing, and customer service
Sales, marketing, and customer service are the three pillars that form the foundation of your business. These three functions are interdependent and require different key performance indicators to monitor their growth and success.
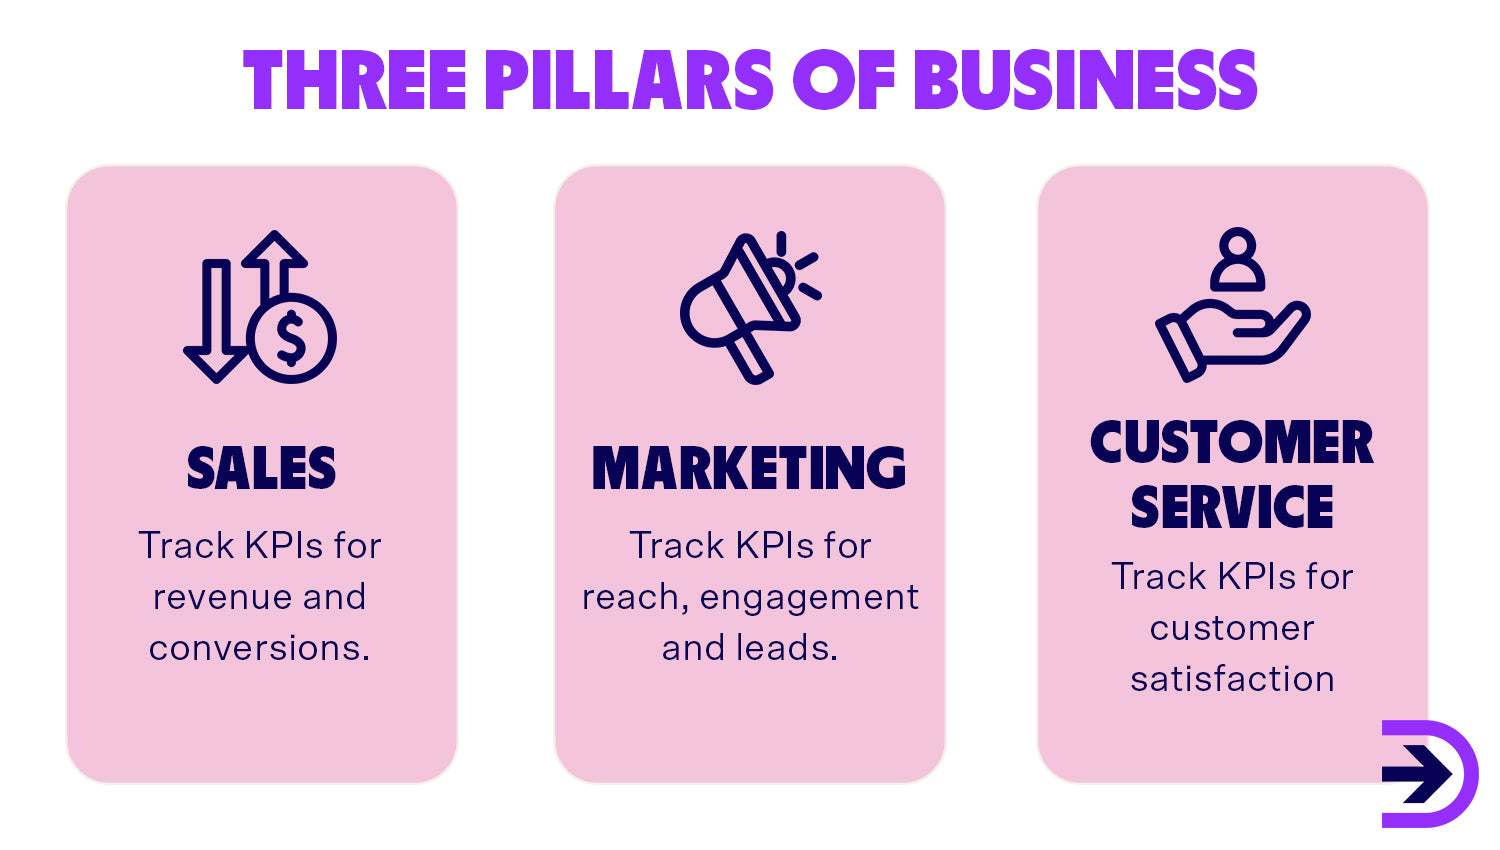
Sales are crucial for generating revenue and driving overall business growth. The success of sales is measured when customers make purchases, and therefore sales KPIs revolve around tracking your business revenue and conversions.
Marketing is the strategic planning and execution of campaigns that promote products and brands. Its objective is to expose more customers to your products, leading to sales. Marketing KPIs involve monitoring these strategies to determine if what you are doing is working.
Customer service is focused on building relationships with your customers. Customer service KPIs directly correlate with customer satisfaction, which is an excellent indicator of how efficient your customer support is.
Each of these functions is interconnected, and one affects the other. Without exceptional customer service, no one would buy your products, and without marketing, no one would know your brand exists. Both these factors would lead to no sales and limited business growth, which is why it’s important for you to track all three types of KPIs.
19 Ecommerce Sales KPI Examples
Tracking sales KPIs is crucial to understanding your business's performance in terms of revenue and conversions. Since sales are the primary source of income for your business, it is essential to monitor them closely to make well-informed decisions. By measuring sales KPIs, businesses can enhance revenue and improve sales performance more efficiently.
Gross profit
This is the profit that remains after subtracting the cost of producing and distributing your products. This profit is also known as sales profit or gross income, and it helps businesses determine how efficient they are in producing items for sale. Gross profit is a key performance indicator that can be easily compared to other KPIs on this list. By analysing gross profit, you can find out if your products are priced correctly and whether you are investing too much or too little in production costs.
Net profit
Net profit is the amount of money that your business earns after all of its expenses and taxes have been paid. This is the final part of your profits and is commonly known as the bottom line, as all expenses have been paid and it appears at the bottom of your income statement. To calculate your net profit, you need to subtract your total business expenses from your total revenue.
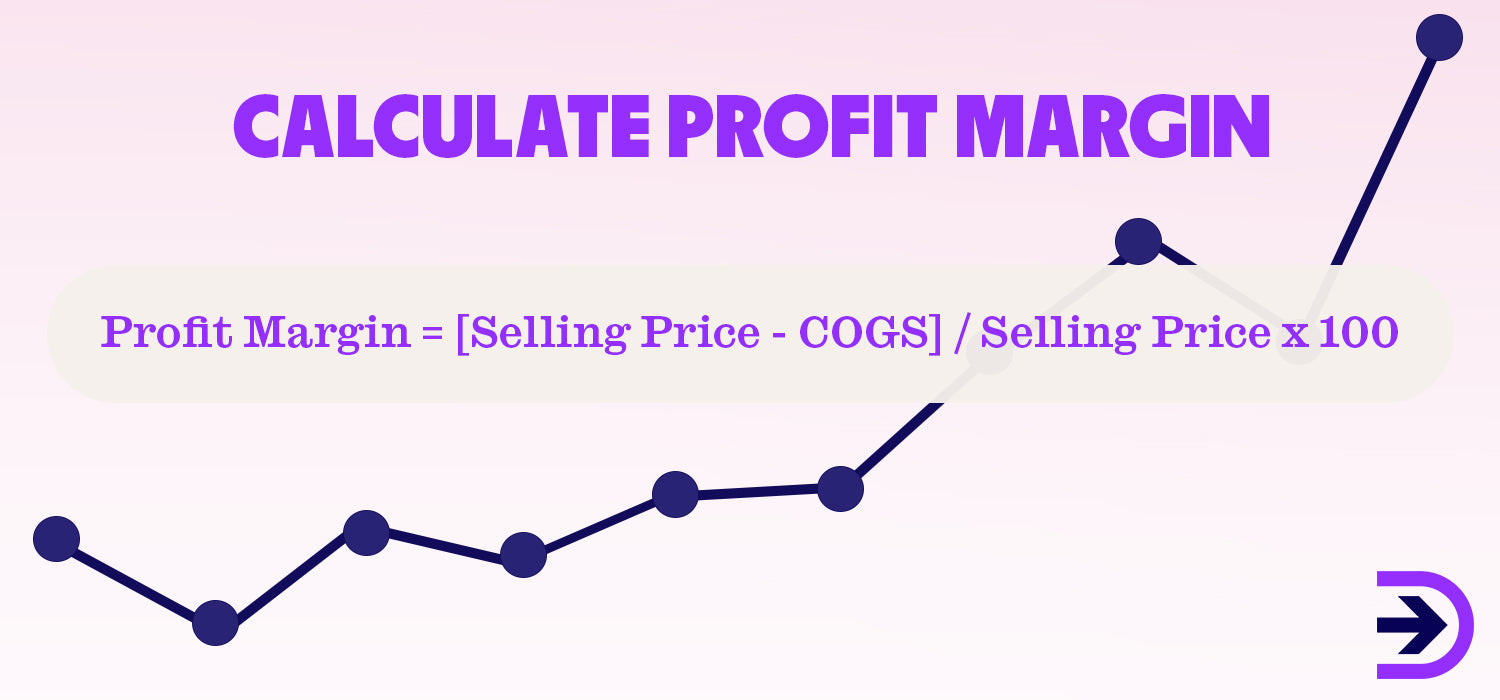
Average profit margin
Profit margin is the percentage of revenue that a company keeps after all production and distribution costs have been paid. It is a measure of profitability that shows how much of every dollar of sales is left over as profit. For instance, if a business has a profit margin of 40 per cent, it means the company has profited 40 cents from each dollar of sales generated.
Average order value (AOV)
This KPI indicates the average value of an order placed by your customers. It is calculated by dividing the total revenue by the number of orders. This metric can be calculated on a daily, weekly, monthly, quarterly, or yearly basis. It is an essential KPI that helps business owners understand their customers' spending patterns.
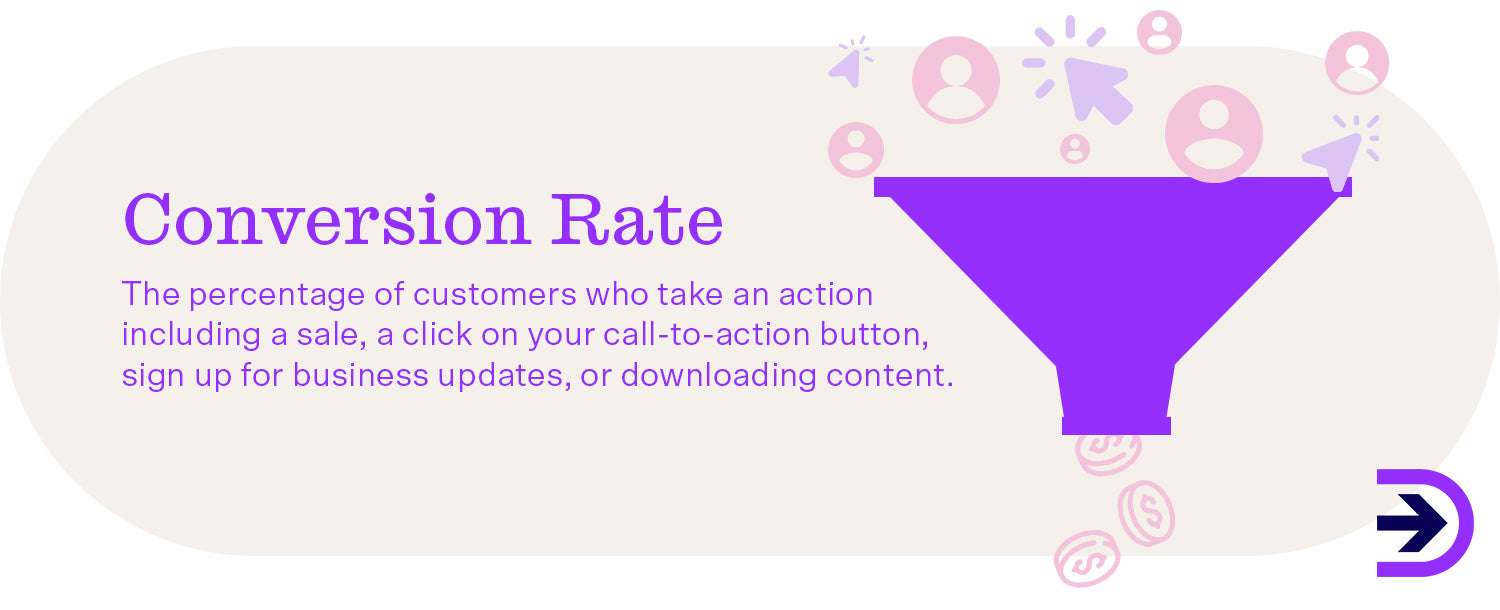
Conversion rate (CR)
This KPI represents the percentage of website visitors who make a purchase. To calculate it, divide the total number of conversions by the number of visitors to your website.
Customer retention rate
This KPI measures the percentage of customers a business retains over a period of time and is a great way to gauge customer loyalty. Improving this KPI is crucial to boosting profits as repeat customers generally spend 67 per cent more than new customers. Also, it usually requires less effort and money to sell to loyal customers compared to acquiring new ones.
Repeat purchase rate (RPR)
This KPI measures customer loyalty. It shows the number of customers who return to your website to make another purchase. It will help you plan your sales strategies and marketing campaigns and give you a good idea of how satisfied your customers are with your brand.
Cart abandonment rate
This KPI tells businesses how many customers are not completing the checkout process once they have items in their cart. If cart abandonment is high, it indicates that there is something deterring customers in the final stages of the shopping journey. It might be that shipping costs are too high, or that the checkout process is too complicated. Whatever the reason, you want your cart abandonment rate to be as low as possible to increase revenue.
Cost of goods sold (COGS)
COGS indicates the costs it takes to sell a product. These costs include manufacturing costs, employee wages, warehouse costs, distribution costs, and any other business costs that allow your products to get to the end consumer.
Competitor pricing
The Rithum Online Consumer Behaviour Report found that 83 per cent of shoppers tend to visit multiple websites before making a purchase decision. This suggests that in 2024, shoppers will be using a multichannel approach when shopping online. Therefore, it is crucial to implement a competitive pricing strategy, which involves keeping an eye on your competitors to ensure that your website is the preferred choice for customers.
Product affinity
Product affinity is a key performance indicator that reveals certain products that are purchased together. By analysing this data, you can develop more effective promotion strategies and increase the average order value of your customers. For instance, if there is a cluster of products with a high product affinity, you might want to group them together in a promotional email or suggest them as related products when a customer is checking out.
Product relationship
Similar to product affinity, product relationship tracks products that are viewed consecutively, making it another effective tool for upselling.
Time between purchases
This KPI measures the duration between two consecutive purchases made by a customer on your website throughout the year. It is calculated as the average number of days between two separate purchases. The average time between purchases varies across different industries, with grocery having the shortest duration and electronics having the longest. For the ecommerce industry, the average time between purchases is about 90 days.
Inventory levels
Tracking inventory KPIs is crucial for efficient inventory management and your sales as a business. With this KPI, you can see things like how much stock you have, how long stock has been sitting in your warehouse, how quickly or slowly stock is selling, and your inventory turnover for the year.
Holding inventory ratio
This KPI tells you the average cost of holding inventory before it sells, including costs such as equipment, labour, and storage. To calculate your holding inventory ratio, you divide your average inventory value by your holding costs.
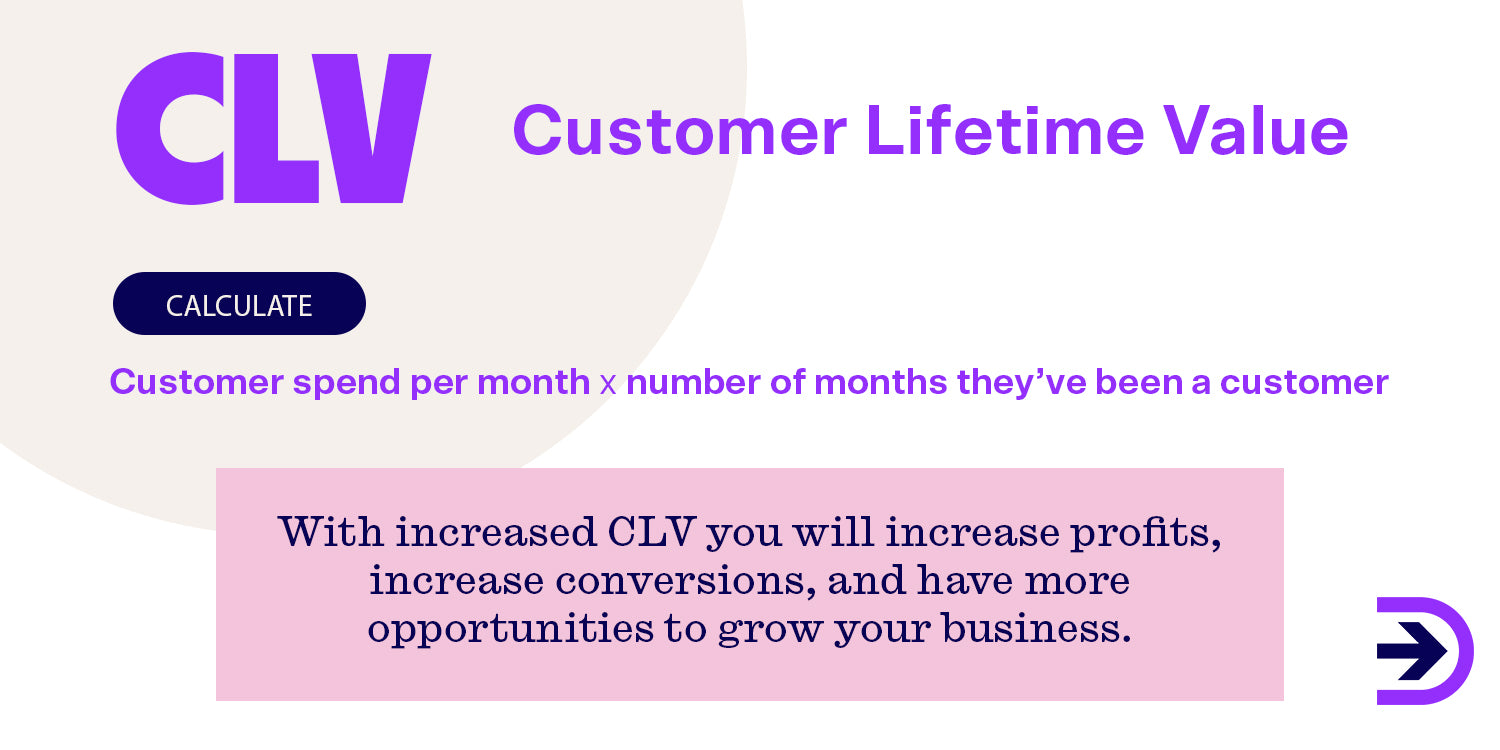
Customer lifetime value (CLV)
CLV tells you how valuable a customer is to you during their relationship with your business. It measures how much you might earn from that particular customer, giving you a great indication of the kinds of sales you will expect to make.
Revenue per visitor (RPV)
This KPI tells you how much a customer spends during a single website visit. This will indicate to you how functional your website is, how good your product personalisation is, and how easy it is to check out.
Customer acquisition cost (CAC)
CAC tells you exactly how much it costs for your business to acquire a new customer. It is calculated by measuring the total costs spent on marketing over a period of time to bring in a new customer.
Churn rate
The churn rate tells you how quickly customers have stopped interacting with your business by either leaving your brand or unsubscribing. In ecommerce, the churn rate is a customer who has not made a repeat purchase over the specific time frame that you have set for the time between purchases.
20 Ecommerce Marketing KPI Examples
Marketing KPIs are metrics that enable you to measure the effectiveness of your marketing and advertising efforts. These ecommerce metrics have a direct impact on your sales KPIs, making them crucial in determining what marketing tactics work and what doesn't. By tracking these KPIs, you can save a lot of money, time, and effort in the long run by avoiding marketing efforts that are ineffective for your specific customer base.
Website traffic
This KPI tells you exactly how many customers are visiting your website. This is a simple KPI, and the more website traffic you have, the more customers are exposed to your brand and products, creating a higher chance for a sale.
Time on website
This KPI tells you how much time customers are spending on your website. If the average time is higher, this is positive. It means that customers are interested in your product selection, rather than being immediately deterred.
Page views per visit
This indicates the number of website pages a customer visits during a single session. If a customer browses more pages, it signifies increased engagement with your brand, particularly when it comes to blog pages or landing pages. However, if the customer has to navigate through multiple pages to locate the product they need, they may abandon your website and switch to a competitor with a more user-friendly interface.
Traffic source
The traffic source KPI is an excellent metric to determine the effectiveness of your marketing strategies. It provides insights into the sources of traffic to your website, indicating which channels, such as social media, paid ads, or search engines, are driving the most visitors to your site.
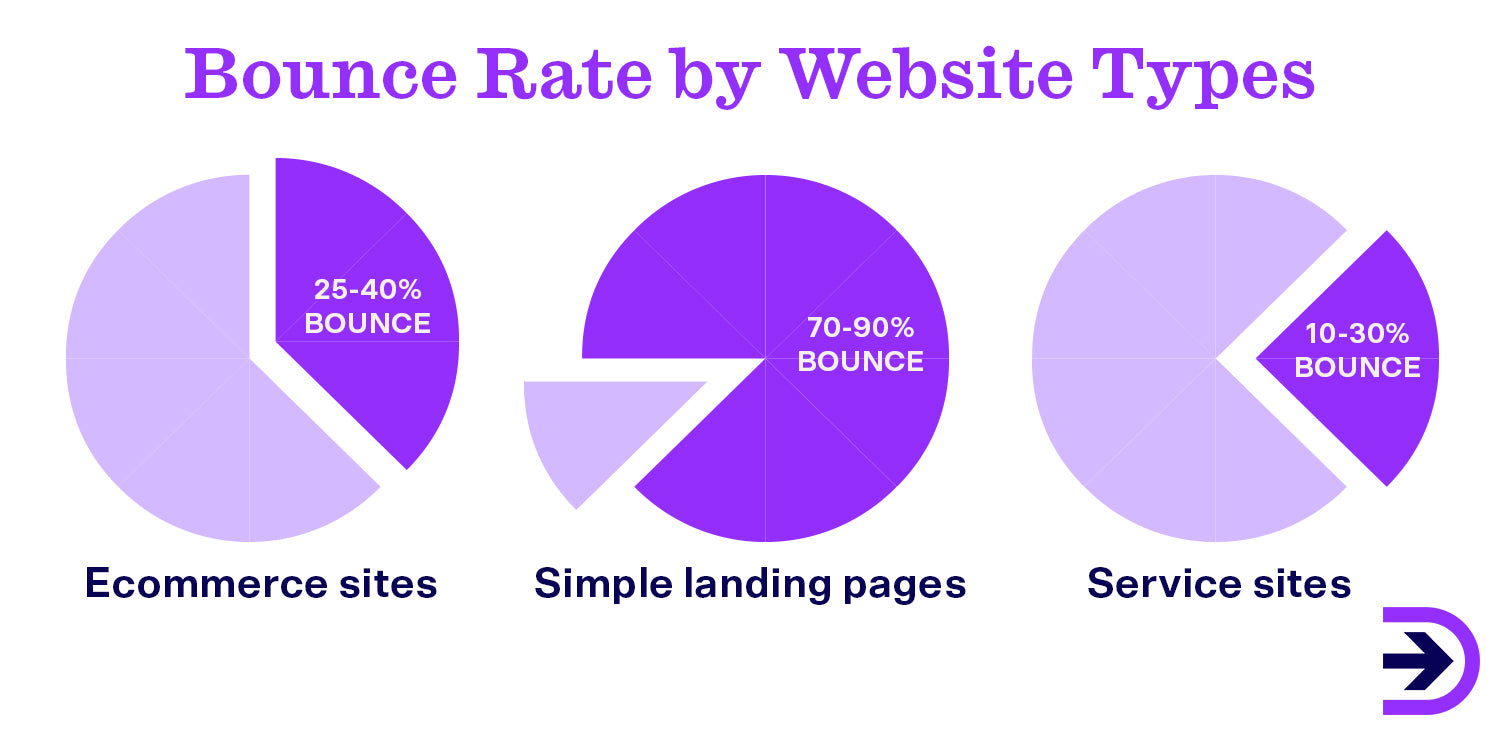
Bounce rate
Bounce rate refers to the percentage of customers who leave your website after only viewing one page. Bounce rate can indicate the aspects of your website that need work. An acceptable bounce rate for ecommerce businesses would be around 25 to 40 per cent.
Clicks
This KPI measures the total number of clicks for a particular link. This could be a link on your website, email, ads, or social media.
Average position
Your average position refers to where you sit on search engine results pages (SERPs) when a customer searches for your website or products. This is a great KPI to tell you how effective your SEO is, and the higher you are ranking on search engines, the better your website visibility.
Subscriber growth rate
This KPI tells you about the rate at which your subscribers are growing. It gives you insight into things like customer loyalty and how effective your marketing strategies are.
Email bounce rate
Email bounce rate refers to the percentage of emails that are not delivered to your customer's inboxes. It is important to keep this number as low as possible. If you notice a high bounce rate percentage, it may indicate a technical issue. In such a case, you should contact your email service provider to resolve the problem.
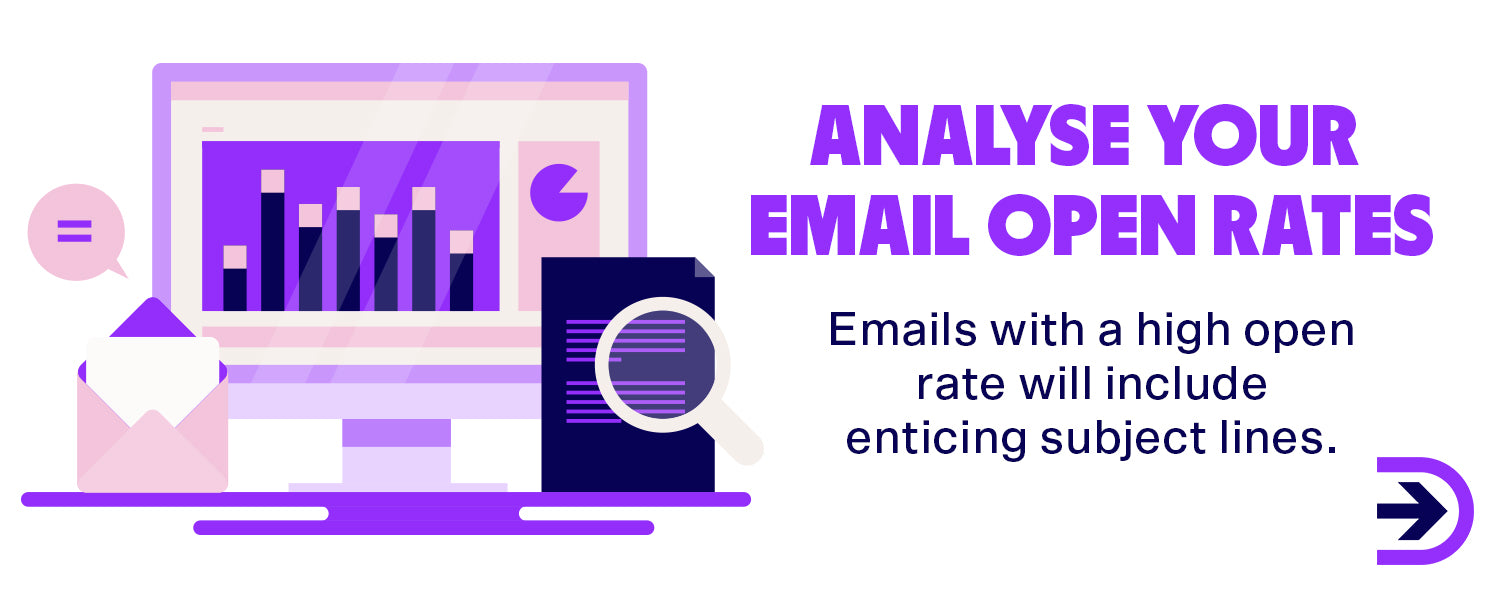
Email open rate
This KPI is the percentage of customers who open your emails. Emails with a high open rate will include enticing subject lines. Welcome emails have an incredibly high open rate of 91.43 per cent, indicating that customers are more likely to read them.
Email click-through rate (CTR)
While email open rates are important to indicate whether your subject lines are exciting enough, email click-through rates can tell you more about customer engagement when it comes to your emails. This KPI refers to the percentage of customers that are not only opening your emails but clicking a link. The link could direct customers to your website by showcasing new products and is important to help improve website traffic.
Email conversion rate
Email conversion rate refers to the percentage of customers who were converted into sales from an email. This is a great indication of the effectiveness of your email marketing and how it contributes to your sales.
Unsubscribes
This KPI tells you how many customers have unsubscribed from your email service, as well as the rate at which customers are unsubscribing.
Social media engagement
Social media engagement is measured by collating your likes, comments, followers, and shares on social media. It tells you how actively engaged your followers are with your content, indicating customer loyalty and how exciting your social media content is.
Social media followers
This metric assesses how many followers you have across your social media platforms and can also track the rate at which those followers are growing. This KPI can tell you about your brand exposure and popularity and indicate whether your marketing strategies are effective.
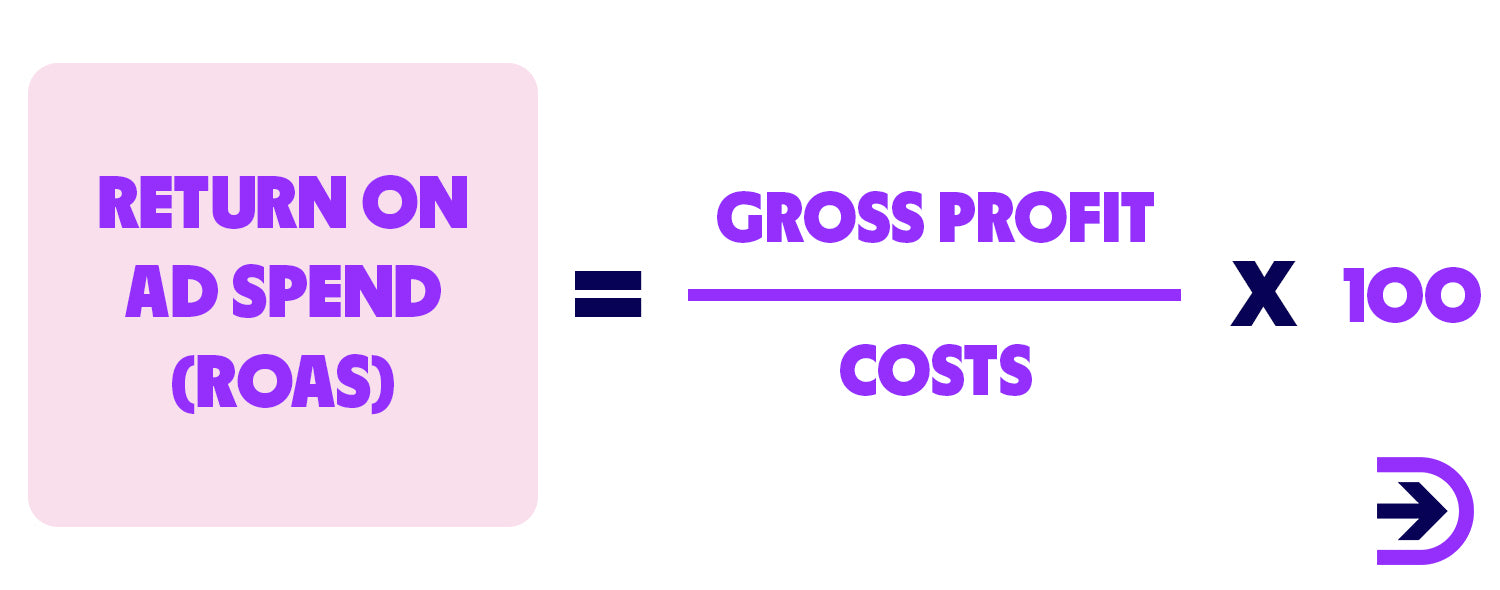
Return on ad spend (ROAS)
This KPI tells you how profitable your paid advertisement campaigns are by telling you how much you are making for every dollar spent on paid ads. It’s extremely useful to your marketing efforts because it can identify the channels that are working well and the channels you should perhaps stop investing in.
Blended ROAS
This KPI tells you how much you are spending across paid advertisement channels to help you get an overall view of the way you are spending your money.
Pay-per-click (PPC)
Every time one of your customers clicks on any of your paid advertisements, this KPI will tell you how much you spent to get that engagement. It’s a great indication of how well your advertisements are working in comparison to how much you are spending.
Blog traffic
If you have a blog page, this KPI helps you assess the number of customers visiting that page by simply filtering your analytics tool.
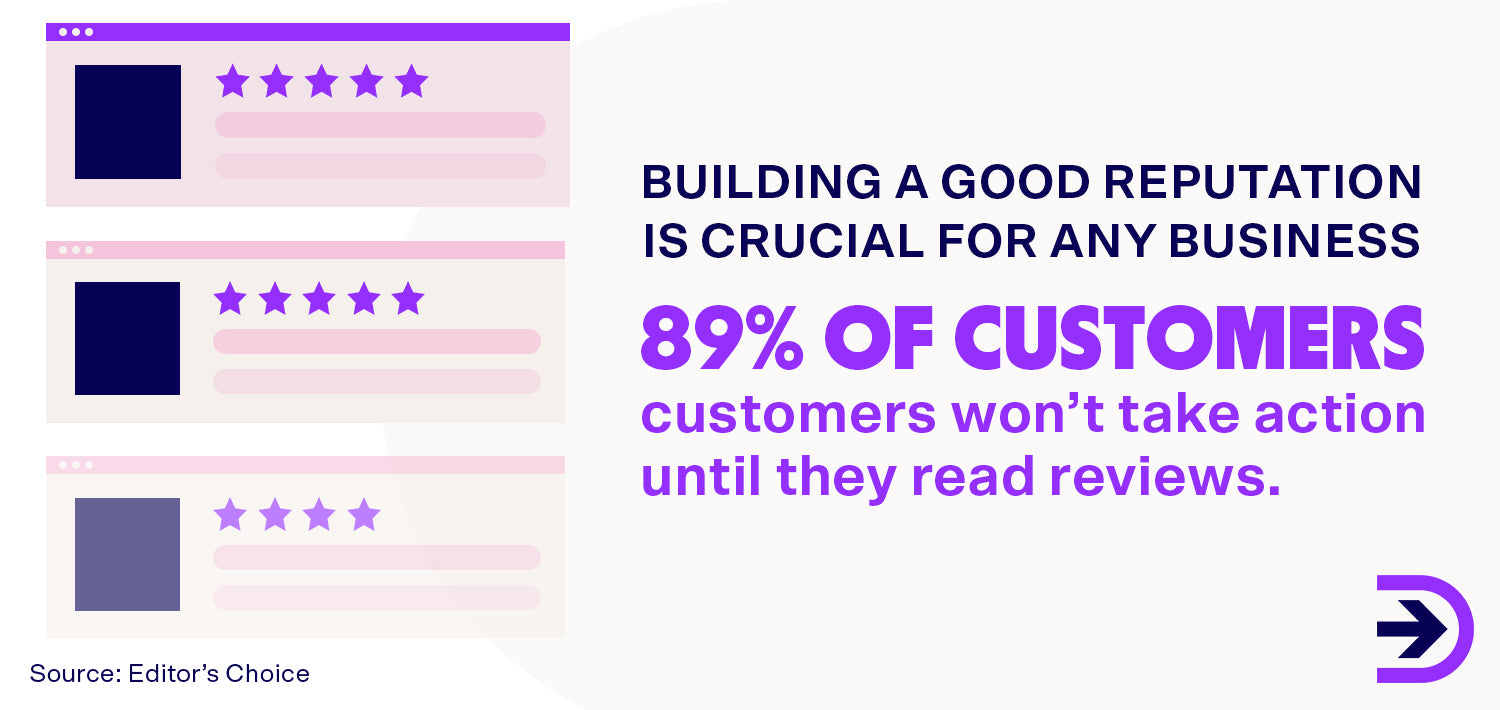
Number of product reviews and their quality
Customer reviews are a crucial part of marketing your products to potential customers. In fact, 89 per cent of customers won’t take action until they read reviews. This KPI allows you to see the number of reviews you have, as well as their quality.
11 Ecommerce Customer Service KPI Examples
Customer service is a crucial aspect of any ecommerce business, and key performance indicators in customer service can help track the quality of service provided and areas that need improvement. By prioritising customer experience, businesses can enhance customer loyalty and brand visibility. To achieve this, it is essential to monitor customer service KPIs closely, which begins by identifying the relevant metrics.
Customer Satisfaction (CSAT) score
Customer Satisfaction (CSAT) scores are obtained through surveys that customers fill out after their shopping experience. The surveys usually ask a common question like: "How satisfied were you with your shopping experience?" Customers respond by rating their experience on a numerical scale, which provides a clear indication of how well your brand is performing from the customer's perspective. It is essential to track this KPI when evaluating your customer service.
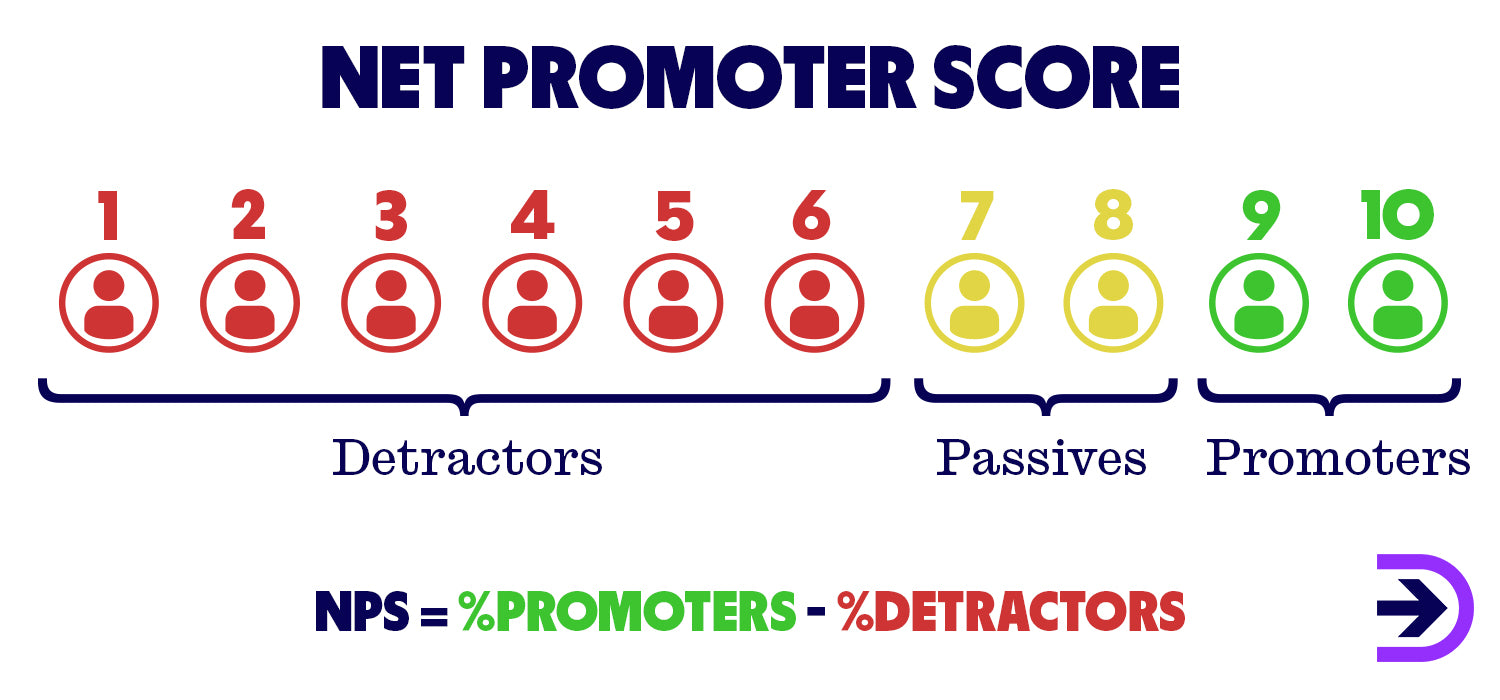
Net promoter score (NPS)
This KPI provides you with valuable information on the likelihood of customers recommending your brand to their friends, family, or colleagues. It is usually measured through a survey question like: "How likely are you to recommend this product or service to a friend?"
Customer service email count
This KPI tells you the number of emails your customers have sent to your customer service team.
Customer service chat count
If your website has a chatbot feature, this KPI tells you the number of live chats your customer service team have responded to.
Customer service phone call count
If you have an available customer service phone number, this KPI will tell you how many calls your support team have received from customers.
First response time
This KPI indicates the time that it takes to respond to a customer’s first enquiry. You want this number to be as low as possible, as this shows you that you have an efficient customer support system.
Average resolution time
This is the average time it takes to resolve a customer problem. Once again, the lower this number is, the better, and you’ll build a reputation for great customer service in no time.
Active issues
This KPI tells you how many active customer issues you currently have that are yet to be resolved.
Backlogs
When it comes to your customer service, you should have an average response time. This time could be a day, a week, or a month. Backlogs refer to the number of unresolved customer enquiries that fall out of your average response time frame.
Concern classification
The concern classification KPI helps you place customer queries in categories to identify trends in customer complaints or queries. This is a helpful tool that can assist you in reducing your overall number of customer queries by identifying aspects of your business or website that need more development.
Service escalation rate
This KPI indicates how many times a customer has asked to escalate their customer support query, that is, to speak to a supervisor or more senior employee. It goes without saying that you want this number to be kept as low as possible, as a high service escalation rate indicates that customers are rarely getting their problems resolved by your support team.
Choosing the right KPIs for your business
Choosing the right KPIs for your business is not a simple task. You need to establish a few things first to ensure that you select the appropriate KPIs that align with your business goals. Begin by setting clear targets and goals for your business so that you know exactly which KPIs to track. This will help you and your team focus on what you want to achieve and how to get there. Additionally, your KPIs will vary depending on the stage of your business. For example, if you are still in the process of selling your first product, your KPIs will be different from those you would track if you had been in business for years.
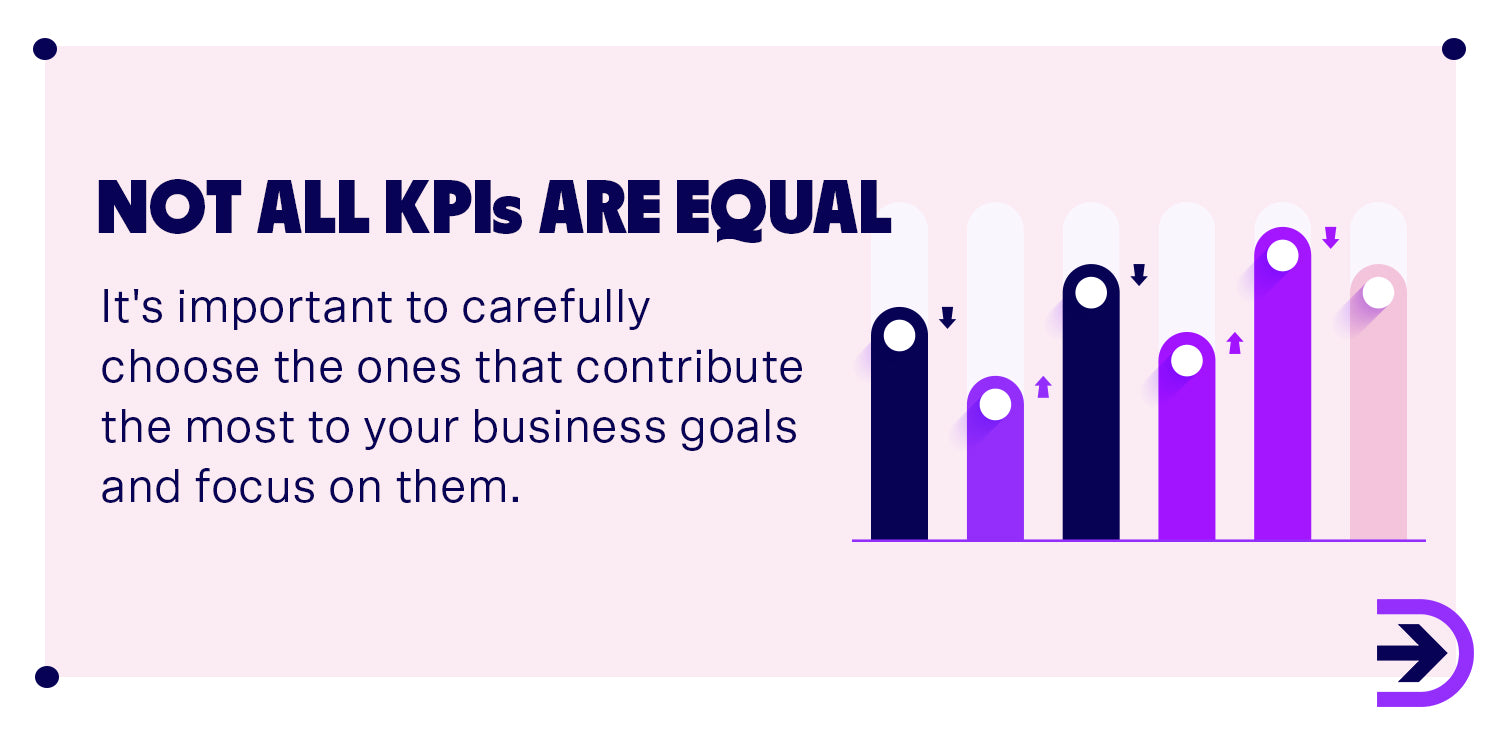
When selecting KPIs for your online business, remember that less is more, especially when you are just starting out. It's better to choose specific KPIs for each business goal instead of one KPI for all your objectives. Picking too many KPIs will only overwhelm you, so it's important to carefully choose the ones that contribute the most to your business goals and focus on them.
FAQ
What are KPIs in ecommerce?
KPIs in ecommerce are key performance indicators that are used to measure business growth and success. They are used to monitor things such as sales, marketing, manufacturing, and customer service.
What are some ecommerce KPI examples?
Some examples of KPIs for ecommerce include website traffic, conversion rate, gross profit, customer lifetime value, social media engagement, and customer retention rate.
What is the most important KPI for ecommerce?
The most important thing to monitor for any online business is conversion. Conversion rate (CR) is the percentage of customers who purchase a product on your website.